AboutThe Client
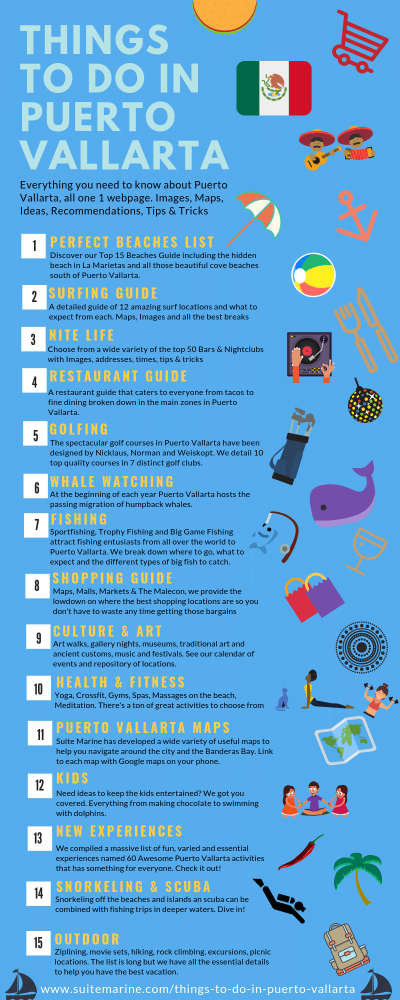
Infographics are a great example of rich content and for me they are a great way to add quality and depth to an article. In the examples below, the client needed articles that were the correct length. The infographics were included in articles of between 800 and 1200 words so quite often the statistical information is condensed into a visual form. The desired effect was for the reader to need to use the article and infographic as a reference and/or to forward the information to others who might be interested.
Whenever possible, we design infographics for multiple purposes. In the cases below, for content development on 2 different websites, we used the infographic primarily with published articles and newsletters but also for distribution on social medias. When infographics are shared carry with them links back to your website and can (or should) create a valuable backlink to your website. Over time is has a positive SEO boost and builds good reputation for your website.


About this project
Infographics are a great example of rich content. They present a depth of information in a condensed easy to consume style. Many readers shy away from reading dense or hard to understand statistics in relation to a topic but will intuitively read a well-designed inforgraphic.
The infographic on the right named Sayulita Rental Property shows return on investment percentages over 3 years and the average costs, expenses and expected income for a rental property in Sayulita, Mexico. The information here supports the idea that an investment in the property can become a good business. It is designed to deliver enough valuable information to a target audience and anyone interested will be intrigued to find out more.
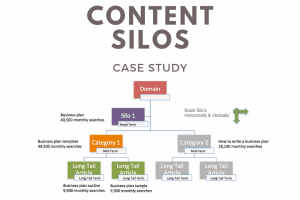
The infographic on the left was designed to support the main keyword for a content silo. The content silo has more than 15 secondary keywords and all are included in the graphic. This example is especially useful on a social media channel like Pinterest where people can scan the information and if they want to know more they can like directly to the main article.
About our process
Our process starts with research and later deciding which information best belongs in the written article and which information is best represented in a graphic. It is essential to distill the most useful information in a readable format.
- Define the goals and objectives for the infographic
- Choose a relevant topic
- Collect the data and information
- Fact check everything anf check the sources
- Decide how to visualize the data
- Write the copy and create a textual outline
- Sketch a wireframe for the graphic


